Start with the symbol and time
Check the stock symbol, report generation time, and quote timestamp. A quote can change while a report retains its original analysis. A newer quote does not mean the report has been regenerated.
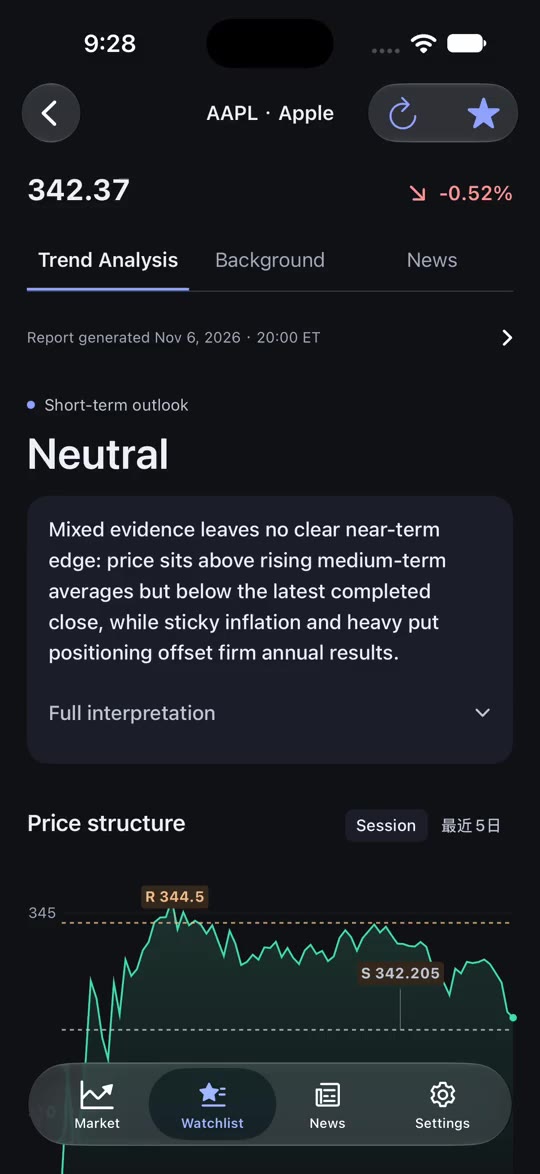
Read the outlook and its limits
Read the one-sentence outlook, then find the condition that makes it plausible and the observation that most challenges it. A neutral outlook can reflect conflicting evidence. When there is too little evidence to assess direction, record that separately.
Trace the view back to evidence
On the price chart, match the timeframe to the outlook and use a completed session when comparing daily indicators. Then check whether other evidence confirms the move or only provides context. Options volatility describes uncertainty, company filings document fundamentals, and news needs a source and timestamp before it can support an interpretation.
Read an archived AAPL example
The archived AAPL report through 2026-11-02 records a $338.32 close, below EMA20 at 341.87 but above EMA50 at 334.37 and EMA200 at 303.54. The report retains a neutral view: short-term price position and the longer-term backdrop do not fully agree. Selecting just one average would leave out that disagreement. This is a reading example from a dated report, not today's Apple stock analysis.
Open the full AAPL stock analysis report exampleFinish with reassessment conditions
Write down one observation you could check again: a completed daily close outside the range described in the report, a new company filing, or a fresh options snapshot with verifiable quotes. When it arrives, compare it with the original evidence and review whether it resolves the disagreement.
Related resources: Our research approach · Historical AAPL report sample · Stock analysis report template
Explore the app screens